

Wikipedia defines analytics as:
“the discovery, interpretation and communication of meaningful patterns in data”
That is a pretty good, succinct definition. Analytics falls into the broader field of ‘business intelligence‘ and is related to ‘big data‘. This is all a bit jargon-esque for me, but the general gist is:
pattern spotting using technology to analyse very large amounts of data .
Other industries
Industries such as marketing and finance are sophisticated users of data analytics, where even a small adjustment in strategy or method can make a big difference to commercial success.
Importantly, this includes predictive modelling rather than just retrospective analysis and pattern spotting.
Good ol’ design & construction
In the design and construction world, we are not that sophisticated- it is usually hard enough to just get something designed and built. Our form of modelling is about creating an electronic object to represent a future physical object, and less about spotting patterns through real-time, predictive & retrospective analysis.
Maybe we should..?
Construction does have one defining characteristic: thin margins and almost unlimited risk. In other words:
- if a project goes perfectly, there might be a <10% profit margin
- but if it goes badly wrong, the losses are virtually unlimited.
Therefore, maybe we should spend more time looking at the data to identify risks & opportunities and improvements to margins.
We have to get away from the idea that BIM is simply a better way to produce drawings, with a sprinkling of model-based purposes such as clash detection or vague ‘4D’ & ‘5D’. Meaningful analysis of the large amounts of model data produced during the course of a construction project is a big opportunity.
The future ?
Imagine if BIM technology was developed to the point where projects could be analysed in advance, during construction and retrospectively. The real power would be where multiple projects could be analysed and compared alongside each other. It would then be possible to spot useful patterns:
• Past performance such as profitability, delays, subcontractor or supply-chain performance.
• Predictive performance, based on similar projects, current metrics & market conditions
• Analysis across multiple projects or regions and involving specific managers, consultants, construction techniques materials or locations.
The technology
As I describe in my post BIM: Where Next ? #1 this would rely on proper database platforms rather than models locked away in discreet files using proprietary file formats.
In the future, it could possible to query a model and determine how long it will take and how much it will cost to build, based on previous experience and analysis of similar projects.
Currently, this kind of pattern spotting usually relies on someone mentally joining the dots across large numbers of projects, regions, disciplines & project types and is open to subjectivity, rather than based on hard facts & figures. By the time a definite pattern has been identified, the circumstances have probably changed or market conditions are different, so it is therefore too late.
[Yes, I realise that there are some systems that will suck data out of Revit models, join it up with SQL databases, Sharepoint lists, Excel/COBie exports and all the rest, but that isn’t really what I mean. Generally, these systems don’t allow real-time or large scale analysis of data]
Imagine this:
A single database (or compatible linked databases) that covers a complete project across design, tender, construction and operation.
The database would include details of each action along with who did it & when. It would be possible to query the database to determine the current status, or roll back to a previous point in time, or see all the changes in a particular time period. For example:
- a designer models an object (let’s say a wall), including the design material, finish etc
- the wall design is modified.
- the model is reviewed and approved by a certifier
- the cost of that wall is calculated from the model quantity
- the cost of the wall when tendered
- the estimated duration to construct the wall
- an RFI is submitted that relates to the wall
- the actual cost of the wall
- the actual duration to construct the wall
- the performance of the wall, say in thermal insulation
and so on….This data would not be captured by people, but could mostly come from modelling applications, construction machine control systems & robotics, onsite monitoring systems, RFID tags, embedded monitoring devices and so on.
The results
Now: extend this idea so that all of the projects for a construction company or design consultancy can be queried and analysed together. It would then be possible analyse these projects to determine:
Contractor
- Should we bid on this project ? i.e are we likely to make a profit ?
- When will this project reach completion?
- How has subcontractor XYZ performed on the last 10 projects ?
- Have we had past problems in using a material/product XYZ ?
- What is the forecast demand for structural steel in a region & are costs likely to rise ?
- Where are the opportunities to accelerate work on this project ?
- Generate an analysis of the delays on this project i.e by area, trade, designer, subcontractor
- Where have most safety issues occurred/what are the highest risk areas ?
- Generate a report for all the work completed in the last 30 days
- Calculate all the work affected by a delay claim including dependencies and knock-on effects.
Consultant
- Does this design model include errors i.e legal or professional indemnity issues ?
- Report on the changes in design over a certain period
- Report on the work designed by a particular person or company
- Does this design comply with building codes ?
- Has a similar design been unsuccessful in the past ?
- How can the design be optimised ?
Client/owner
- Is this building performing as designed ?
- Which tenants are using the most energy ?
- Based on current and predicted failure rates, determine the best replacement strategy for air conditioning plant.
- Compare the rental yields and lease expiry across all assets in the portfolio
Is it possible ?
You might say that this isn’t technically possible, and I agree such a technology does not currently exist. Current BIM only captures steps 1 & 2, possibly 4 and parts of the others.
However, I have an app on my phone that keeps track of every bus, train & ferry in Sydney. It knows the route and timetable for all of them and tells me where each one is & if it is running on schedule. I imagine there is some kind of reporting system that analyses this data and works out fastest/slowest/most profitable routes and allows the transport companies to plan accordingly.
So surely, if we are talking about billions of dollars of construction work, it would be worthwhile ?
Therefore, I think it is possible, even if it hasn’t been created yet.
Examples
Since this technology does not exist at the moment- I can’t demonstrate exactly what I mean. I have a few examples which fall more into the category of very basic analysis, rather than analytics.
Using ‘Business Intelligence’ tools such as Microsoft BI Desktop (or even lowly Excel) to analyse and report on BIM data, a dashboard view of a model project can be generated. As I have explained above, the real power would be when multiple projects or assets could be compared and analysed together.
Analysis of curtain walls
Analysis of curtain walls for a high rise building, showing distribution of panel sizes across each floor. Without having to look through any drawings, these charts give a good overview of the number and type of different panels.
Analysis of design clashes
Analysis of design clashes showing drill-down using discipline, dates, status and XYZ location.
Analysis of concrete floors
An analysis of designed floors using Dynamo & BI Desktop. Without having to look through all the drawings, this analysis gives a good overall picture of the structural design of this high-rise office building. As a constructor, I would question why there are so many different slab thicknesses (150,200, 250, 275, 300, 350, 375, 400, 450 etc) and each floor is different. Level 18 is also clearly a structural transfer floor as it is very different to all the other floors. Repetitive construction is much cheaper and quicker so this design could probably be optimised.
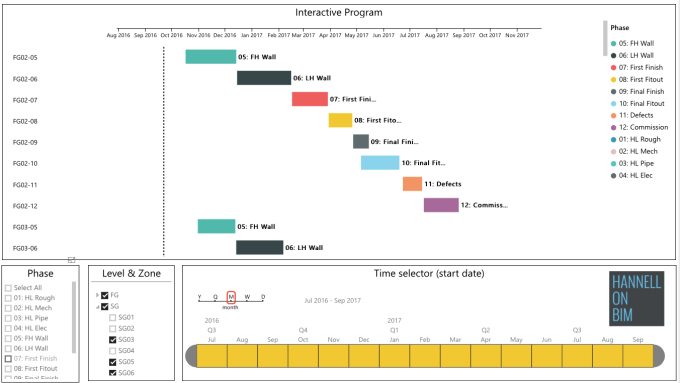
Interactive program
This interactive program reads data from Primavera P6 and combines it with spatial relationships- refer page 2 of 3.

You must be logged in to post a comment.